Getting started
Explains how to install the rendererDownload the distribution
Here we explain how to install and run the lightmetrica renderer using the binary distribution. Another option is to build the framework from the source. In this case, please refer to this section.
Requirements
- Hardware
- 64-bit CPU with SSE4.2 support
- 4GB RAM
- Operating system
- Windows 7 and upwards
- Mac OS X 10.10 (Yosemite) and upwards
- Any linux distributions (checked with ubuntu 14.04)
Download and install
Click the Download in the menu bar, and download the distribution for your environment. After download, unzip the file, and you will find the directory containing an executable lightmetrica. The distribution also contains some example scene, and files for the plugin development.
Next open the console (command prompt for Windows) and move to the directory you just extracted. Executing the file lightmetrica would generates the following message. If you can see the message, the setup is complete.
Usage: lightmetrica [subcommand] [options]

Welcome to Lightmetrica!

Lightmetrica: A modern, research-oriented renderer
Documentation: http://lightmetrica.org/doc

Subcommands:

- lightmetrica help
  Print global help message (this message).

- lightmetrica render
  Render the image.
  `lightmetrica render --help` for more detailed help.
Command line options
As the initial help message suggests, executing lightmetrica render --help command would generate the following message:
Usage: lightmetrica render [options]
Options:
  --help                        Display help message (this message)
  -s [ --scene ] arg            Scene configuration file
  -o [ --output ] arg (=result) Output image
  -v [ --verbose ]              Adds detailed information on the output
Current options are fairly simple. -s or --scene option specifies the path to the scene configuration file. -o or --output option specifies the name of the output image. Note that we don’t have to specify the extension of the output file (e.g., some_result instead of some_result.hdr) because the output format is selected within the scene configuration file. For enabling debug messages, put -v or --verbose option.
Rendering an example scene
An example scene
The binary distribution contains several example scenes in example directory. Let’s render one of the scenes.
We assume the current directory is the same directory as the executable lightmetrica is placed. Executing the following command would generate an result.hdr file.
./lightmetrica render -s ./examples/001/scene.yml
As the command implies, we need to specify the scene file with -s option.
Also we can change the output file name with -o option.
The example scenes generate images with Radiance HDR format. In order to open the file you can use the software like this.
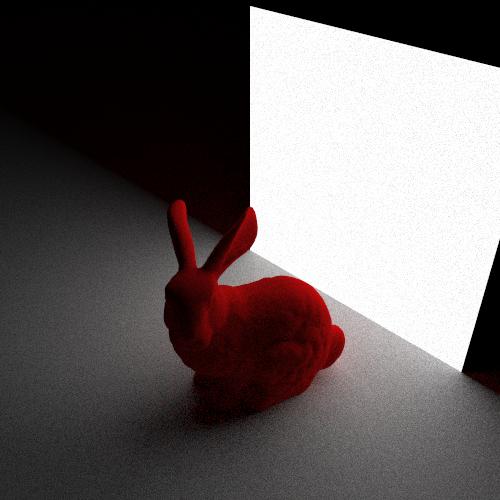
If you can successfully open the rendered image, you would be able to see the following image. If something wrong happens, please look at Trouble shooting section.
Reading output messages
We designed the output messages from the renderer as human-readable as possible. Here we describe how to read the output messages including error messages from the renderer. In the first few lines of the log message would be like this:
| INFO  0.001 |
| INFO  0.002 | Lightmetrica
| INFO  0.004 |
| INFO  0.005 | A modern, research-oriented renderer
...
The output messages are formatted with the same manner.
In the first row separated with |, we shows the type of the messages and the time (in seconds) that the message is generated.
If you enabled the -v options, you can see the addtional rows useful for the debugging purpose:
| TYPE  TIME  | FILENAME  | LINE  | TID |
| INFO  0.003 | main.cpp~ | @ 402 | # 0 |
| INFO  0.005 | main.cpp~ | @ 402 | # 0 | Lightmetrica
| INFO  0.008 | main.cpp~ | @ 402 | # 0 |
| INFO  0.011 | main.cpp~ | @ 402 | # 0 | A modern, research-oriented renderer
...
FILENAME shows the name of source file where the message is generated, LINE is the line of the code where the message is generated in the file specified by FILENAME. TID shows the ID of the threads from which the message is generated. Note that the thread ID changes from run to run, except for the ID of the main thread (0).
There are four types of log messages as follows. The messages are colored according to the severity of the message types.
| Type | Meaning | Color | Description |
|---|---|---|---|
INFO |
Information notice | White | Messages for reporting rendering processes. Scrutinizing this type of messages is a good way to find inconsistencies when you have some errors. |
WARN |
Warning message | Yellow | Messages for something unexpected happens in the renderer, but not affect the execution of the rendering. |
ERROR |
Error message | Red | Something wrong happens in the renderer. The application should stop immediately. |
DEBUG |
Debug message | Gray | Messages only for debugging purpose. You can safely ignore the messages. |
We deliberately changes one character in examples/001/scene.yml.
The sensor_2 are not defined and this file would generates some errors.
…
nodes:
  - id: n1
    sensor: sensor_2  # Changed from sensor_1
    transform:
    …
Executing the command lightmetrica render ./example/001/scene.yml would generate the following messages (partially excerpted):
| INFO  0.152 | ............ Loading asset 'sensor_2'
| ERROR 0.156 | ................ Missing 'sensor_2' node
| ERROR 0.162 | ................ See around line 5 @ scene.yml
| ERROR 0.166 | ................    3 |
| ERROR 0.169 | ................    4 |   assets:
| ERROR 0.174 | ................    5*|     sensor_1:
| ERROR 0.183 | ................    6 |       interface: sensor
| ERROR 0.191 | ................    7 |       type: pinhole
| ERROR 0.197 | ............ Failed to create emitter
| ERROR 0.202 | ............ See around line 84 @ scene.yml
| ERROR 0.206 | ............   82 |     nodes:
| ERROR 0.210 | ............   83 |       - id: n1
| ERROR 0.214 | ............   84*|         sensor: sensor_2
| ERROR 0.218 | ............   85 |         transform:
| ERROR 0.222 | ............   86 |           lookat:
The error messages shows several candidates to check:
Missing 'sensor_2' nodeimplies there is no definition forsensor_2and suggests to see around the definition of assets (line 5).Failed to create emitterimplies failure to create the sensor and suggests to check the reference to thesensor_2(line 84).
In this case, the latter is correct implication to the cause,
so we can successfully fix the error by changing sensor_2 to sensor_1.
This example shows the basic process of the debugging the scene configuration file. As we can see, the log message is an powerful tool to find the cause of errors.